Real-Time Greenhouse Weather Monitor and Forecaster
Built a real-time streaming device for greenhouse monitoring using a microcontroller and AWS suite of programs, focusing on efficient data handling and system stability.
- Tools used : AWS (IOT Core, Kinesis Data Streams, Firehose, Managed Service for Apache Flink, Gateway API, Sagemaker, S3, Glue, Lambda, DynamoDB), Python, Arduino (C++), HTML, JavaScript
- Category : AWS, Microcontrollers, Time Series, Deep Learning, Real-Time Streaming
- Year : Dec 2023
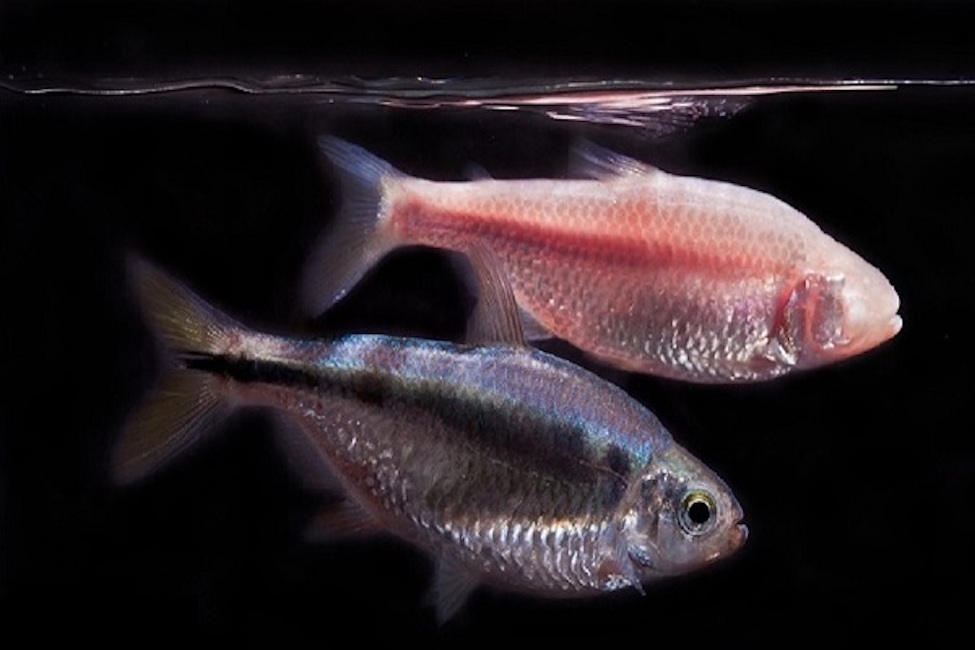
Comparison of Live vs Dry Feed
Determined optimal feeding for A. mexicanus through regression analysis, significance testing, and other Exploratory Data Analysis. Survival, Growth and Fecundity were the metrics used to evaluate the difference between feeds.
- Tools used : R(tidyverse, gt, ggridges, ragg, qqplotr, EnvStats, rstatix, ggpubr, broom)
- Category : Exploratory Data Analysis, Outliers, Linear Regression, ANCOVA
- Year : June 2021
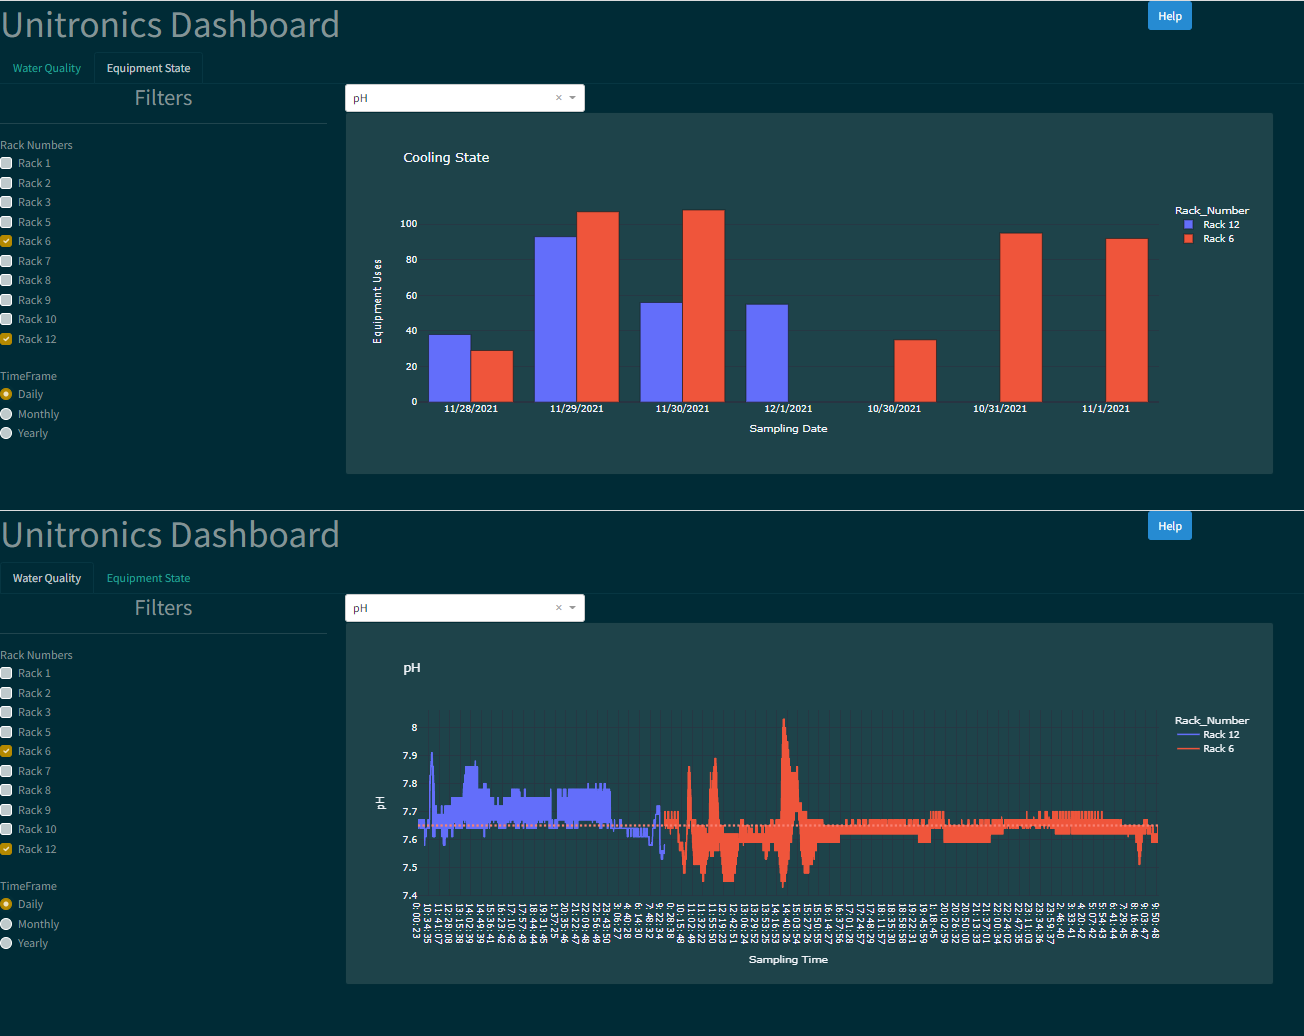
Facility and Water Quality Dashboard
Evolution of a reporting dashboard from VBS to Dash to Power Bi. End-to-end development of a postgresSQL database, ETL pipeline, and dashboard visualization that allows technicians to understand current system health at a glance.
- Tools used : Python(Dash, plotly, Pandas, NumPy), Linux, postgresSQL, Power Bi
- Category : Dashboard, Data Engineering
- Year : January 2020-2022
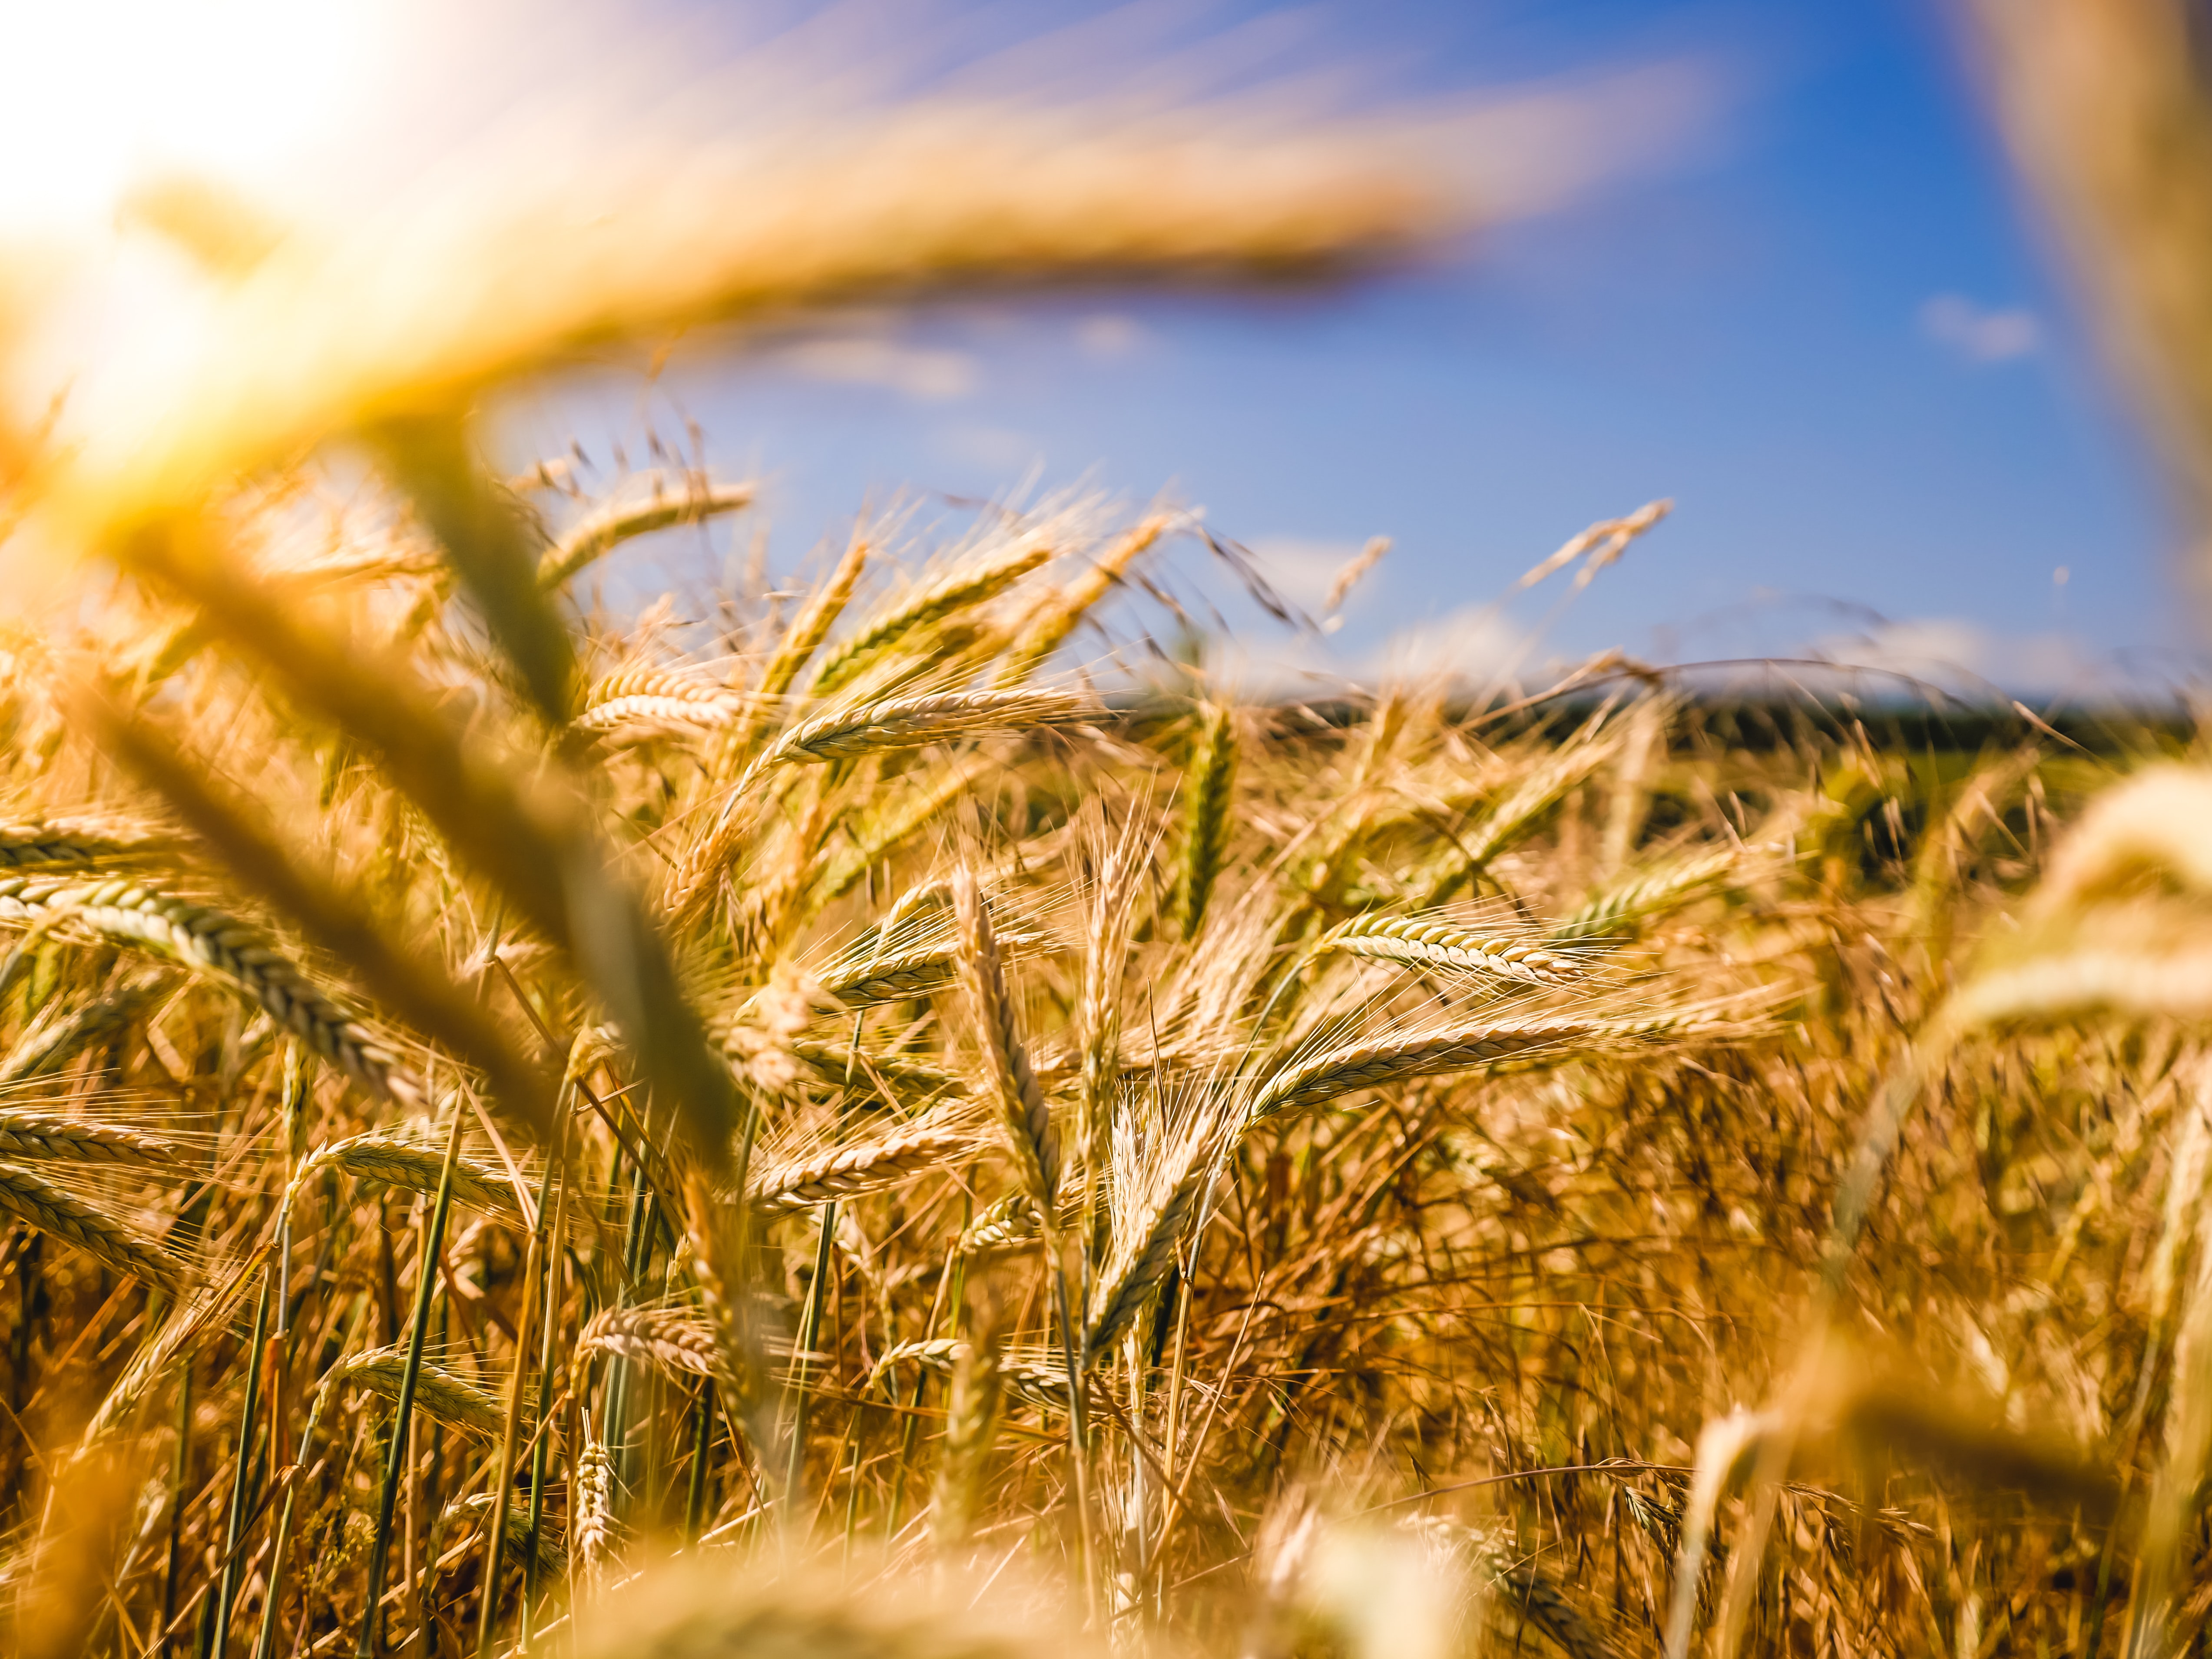 Photo by
 World Agricultural Dashboard
A Flask-plotly dashboard depicting the state of the world through the lens of Agriculture. How have population, land-use, economics, and major world issues changed since the start of the Green Revolution?
- Tools used : Python(Flask, Plotly, Pandas, NumPy), Heroku
- Category : Exploratory Data Analysis, Dashboard, visualization, Deployment
- Year : August 2022
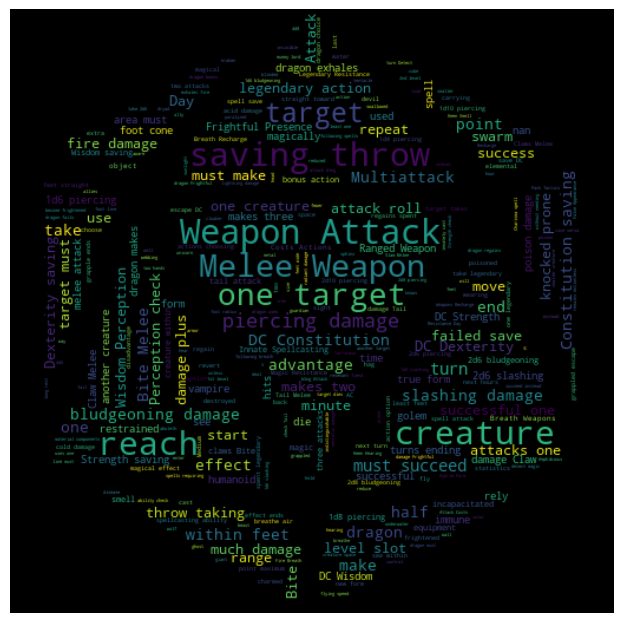
DnD Monster Stat Block Generator
Scraped, Visualized, and Compared DnD's Monster Stats and Traits. Used this data to create a neural network using TensorFlow and Dash which allows the User to generate Monster stat blocks based on player level, environment, type, alignment, and difficulty desired.
- Tools used : Python (NumPy, Pandas, Seaborn, Matplotlib, Plotly), Dash, TensorFlow, Docker, AWS Lightsail
- Category : Machine Learning, Exploratory Data Analysis, Neural Network, Cloud Deployment
- Year : May 2022